
How Microsoft Power Platform is helping to modernize and enable...
In this webinar, our experts showcase a variety of demo use cases of how different components of the...
We are living in a fast-growing world surrounded by a variety of expanding technological advancements. Everything is changing rapidly – daily it seems – so, to achieve success, businesses need to be ahead of the competition by planning future outcomes accurately. In other words: Business Forecasting! Senior leaders must make strategic decisions in order to improve productivity and profitability, and to do so they need reliable forecasting. A common aspect of Business Forecasting is predicting the sales numbers for coming years, which is really very helpful for any kind of business. Business Forecasting can be done using any of these techniques:
Each of these techniques has its own approach and advantages depending upon the source used and people using it. From our perspective of using Microsoft Dynamics 365, we are capable of playing with historical data in Power BI. Let’s start with the basic key points of our approach, and then we will start building a report using Power BI. Our forecasting is based on a few basic DAX queries that will help us determine these key measures:
Now, let’s get to building our Power BI report!
Part I: Loading Prerequisite Tables with Selective fields
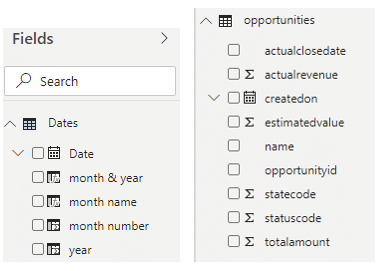
Because we are building the report based on Sales of opportunities, we will be requiring two tables: an Opportunity table and a Dates table. You can take any other entity table, as well, depending upon your unique requirements.
Note: You might be wondering why we would need an additional Dates table when we already have Date fields in our Opportunity entity table. The reason is that we need a contiguous Date table, because in future calculations we will be using the DAX function DATEADD, which needs contiguous dates data as a parameter.
If you have any queries related to how this Dates table is formed you can simply go through this link => create contiguous Dates Table in Power BI
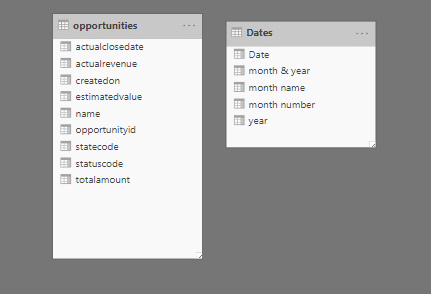
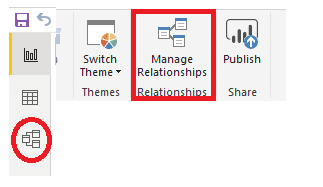
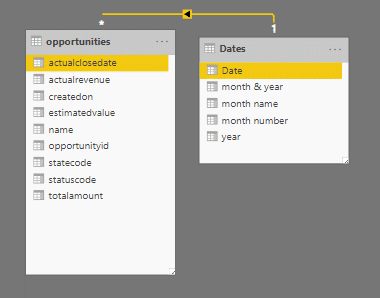
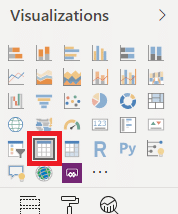
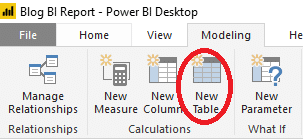
Once we have our two required tables, we need to manage the relationship between them. Click on the circled icon below and then proceed to the Relationships tabs. There you will see two tables that, as of now, have no relation. We will create that relationship by clicking the squared icon on the top of the ribbon menu:
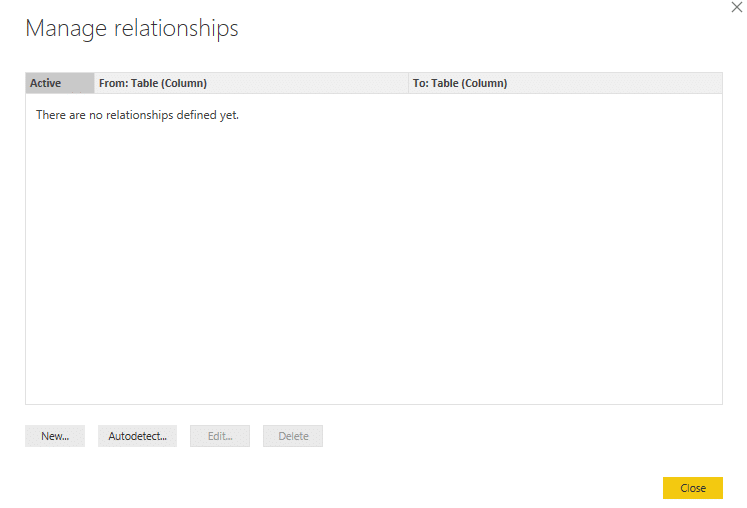
Now you can see the Manage relationships window, as shown below. Click on New and select as shown below to specify the relationships between fields from both tables:
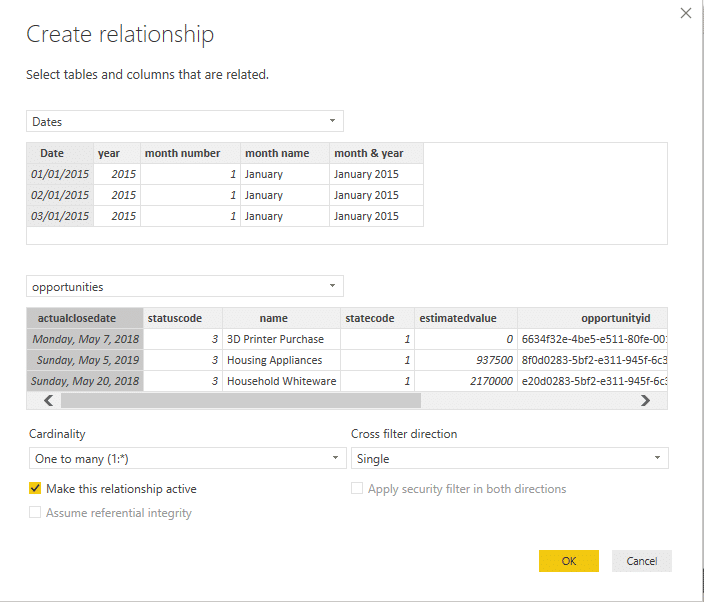
The relationship is now shown with an arrow from the source table to target table – in our case, it is from the Dates table to the Opportunities table.
Let’s go to back to Report tab and select Table chart from Visualizations area:
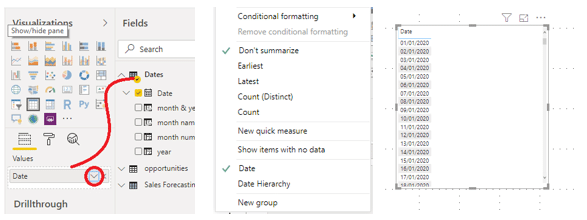
And then select Date column from Dates table, click on the carrot icon and select Date instead of Date Hierarchy, which leads to the third image below showing Dates:
Part II: Creating Measures
Now we will start creating our measures for the forecasting process. For this, we need to create a new table: click Modeling > Calculations > New Table, and give this table a name, like Sales Forecast.
Now comes the Dax part of the process. For all those who are new to Power BI, DAX stands for Data Analysis Expressions - i.e., expressions or formulas that are used for data analysis and calculations.
Now it’s time to create those measures mentioned earlier. A brief overview of measures: they perform real-time calculations based on your interactions with data on your report. Usually, measures are used in aggregation calculations such as sum, average, minimum value, maximum value, and counts, or more advanced level calculations made using DAX formula.
Creating measures is pretty simple. There are 3 ways of doing it.
Home tab > Calculations section > New Measure:

Or
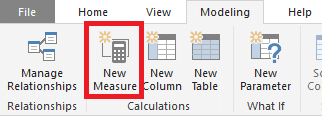
Modeling tab > Calculations section > New Measure:
Or
Go to the respective Table and click on the ellipses. Here you will find list of options that includes New Measure.

Now, one by one we will create measures by using the below-mentioned DAX formulas and functions:
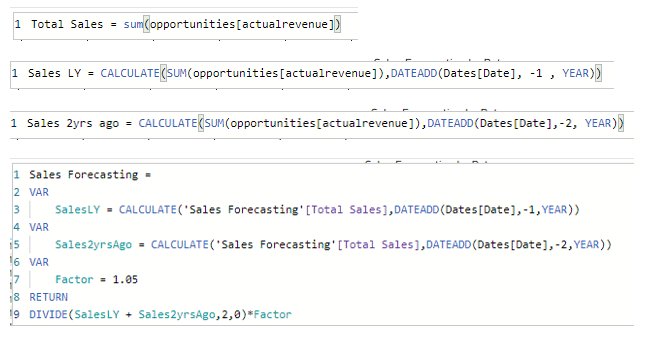
The last part might need to be explained: we are simply calculating Sales LY and Sales2yrsAgo values into variables and returning their average calculation. But here one thing is new: Factor. This is a variable to forecast, and we are assuming 5% progress in the sales; obviously, this will vary by organization and by forecasting logic.
One more measure is pending, so let’s quickly create that one. Here we are calculating the Cumulative Sales Amount bringing that amount forward so that we can also predict earned Revenue in reports:

Here is the in-built functions syntax used above:
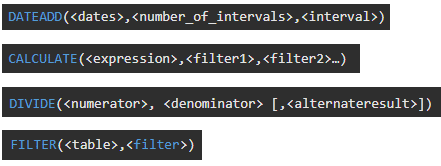
Note: In our calculations for this report, we are only considering 2 years of historical data, but that is not the limit. You can calculate as much historical data as you have – let’s say 5 or 10 years back. It all depends upon the available historical data and then return their average.
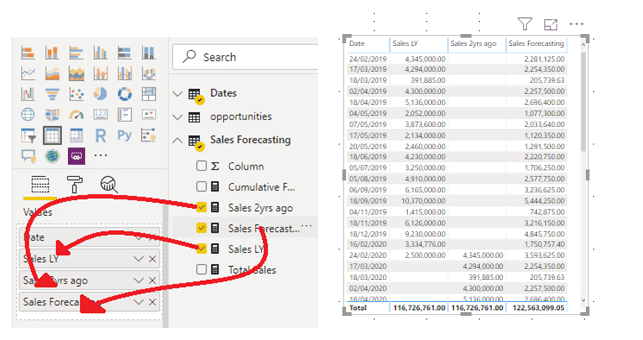
Now we will make use of above-created measures, so let’s bring them in our table chart and see how it looks:
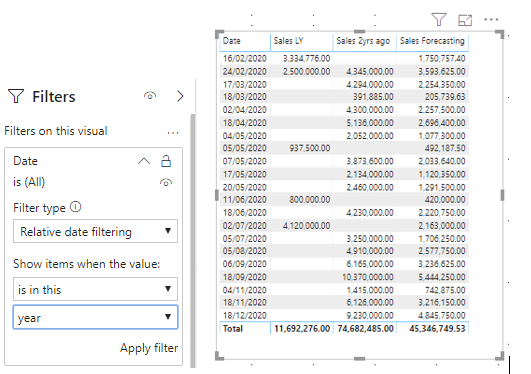
You can see how the chart is pulling useful information as per the calculations we have made so far, but still there is one catch: the chart is pulling all the dates, but for better forecasting representation we need to apply a filter for only dates for this current year. So for that, we go to the Filters area and set Date filter to current year data only, as shown, and then hit Apply filter. Now we can see in the second image that the chart is pulling data filtered on current year dates only:
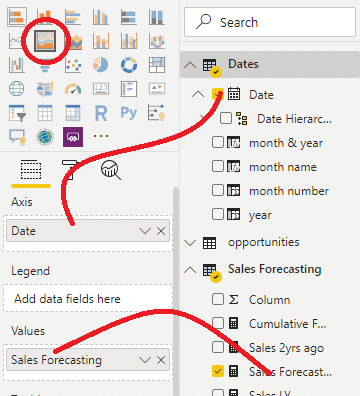
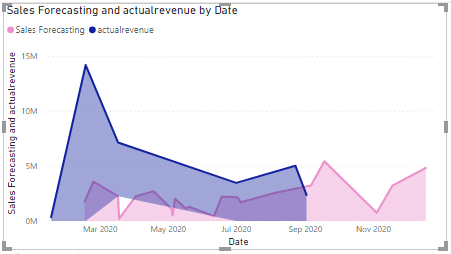
Let’s build few more charts for better visualization. Select Area type chart from Visualizations area and bring our fields over it as shown below:
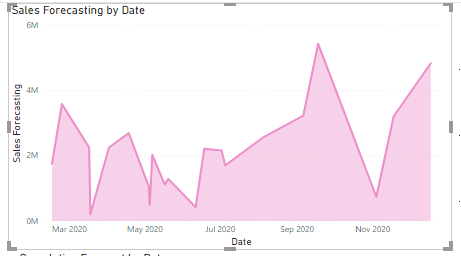
Excited to see the chart we have built so far! Most surprisingly, this chart is showing future data, as well. Our source dummy data included records through September only, but still we are able to see data for the entire year. This is the real Business Forecasting to predict future data by using available historical data.
Now let’s do some more with this chart – let’s add our exact sales amount for the current year so that we can compare it, as well.
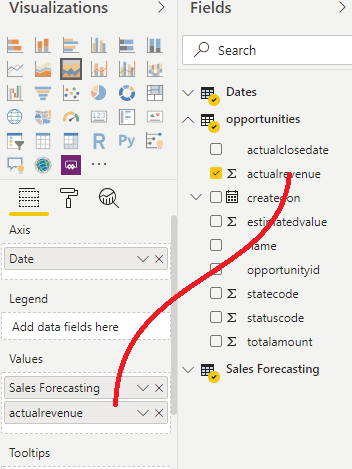
Let’s see now what visual effect this has on our chart:
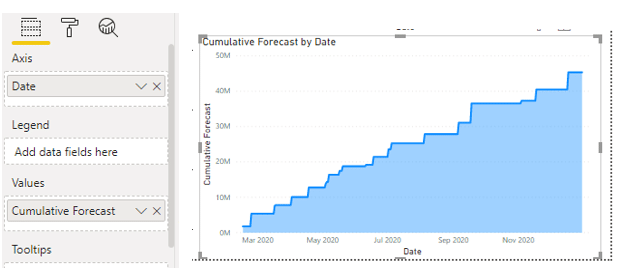
Now, copy this chart and paste it over the blank area but this time just change Sales Forecast to Cumulative Forecast measure and see how it beautifully shows you the Cumulative Forecasting Data:
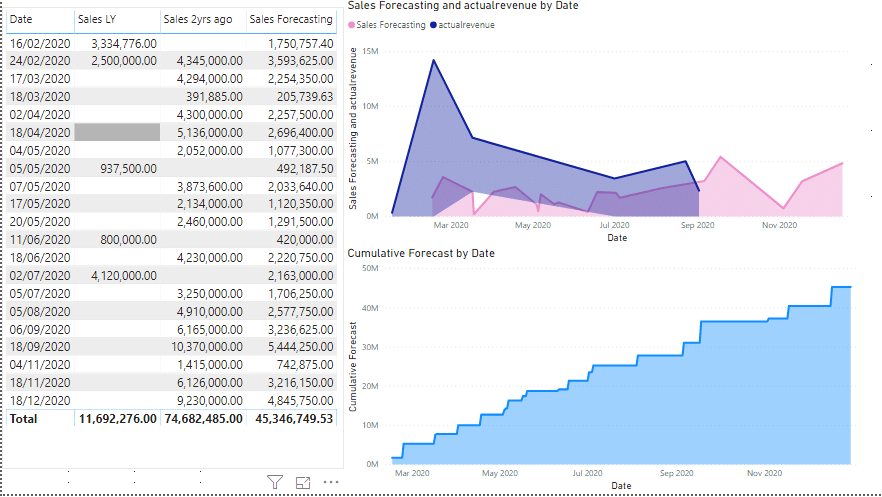
After all this effort so far, we have finally achieved a cool Power BI Report! This is the final report:
We hope you enjoyed it. We will continue posting tricks and cool features of Power Platform.
Happy Power BI’ing!