
How Microsoft Power Platform is helping to modernize and enable...
In this webinar, our experts showcase a variety of demo use cases of how different components of the...
In today’s post, we will create a Power BI report using a view in Dynamics 365 Customer Engagement (D365 CE) online and with the Tabular Data Streaming (TDS) feature. Today, there is no out-of-the-box option to connect views in D365 CE online from Power BI and develop reports as a data source. However, the TDS feature in Power Platform makes it possible!
In short, TDS allows connecting to D365 CE online database from Power BI so that we can send a SQL query and retreive data from Power BI. Connecting entities and views in D365 CE online gives us the ability to design and create “lean” data models in Power BI.
We only have an option to use the entities and create a data model today, which means we make relationships between entities (tables), and the data model becomes complex. We experience some report and data refresh performance challenges at the end. It is hard to create a data model with star schema from the OLTP – transactional database directly. If we create a view that already joined with some related entities in D365 CE, we can use the view as a fact table in Power BI data model. For example, we would join accounts and other dimensional entities to a fact table (view). That is a star schema in Power BI data model!
Let us demonstrate a simple example. Let’s use Accounts and Products as dimensional entities (tables) and create a view with Opportunity and Opportunity Product entities in D365 CE online. We use the view as a fact table in the Power BI model.
The following is a “recipe” of tools to make this demo:
We introduce you to a tool in XRM Toolbox - FetchXML Builder. This tool allows converting FetchXML to SQL query. We keep our effort to a minimum without writing a single line of code!
The following are prerequisites for this demo:
*Please see the reference section at the end of this blog for the links to the resources above.
The following are high-level steps in the process:
Let’s start building a Power BI report by following the steps above!
1. Login to https://office.com and launch Power Apps
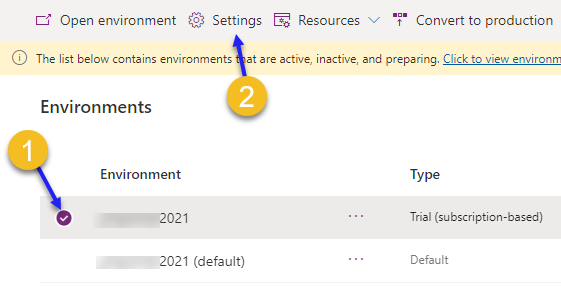
2. Open Admin center

3. Select an environment and click on Settings
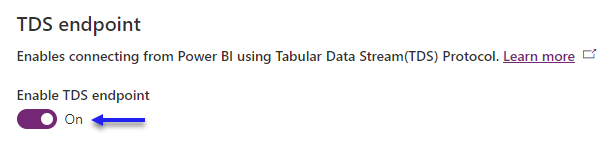
4. Turn on TDS endpoint after navigating to Product / Features
1. Launch D365 CE Sales App
2. Open Advanced Find
3. Select Opportunity Lines entity, select Opportunity as linked entity; select Status and set attribute as Won
4. Click on Edit Columns and configure columns:
5. Click on “Download Fetch XML” in the ribbon

6. Open the FetchXML file and copy all the code
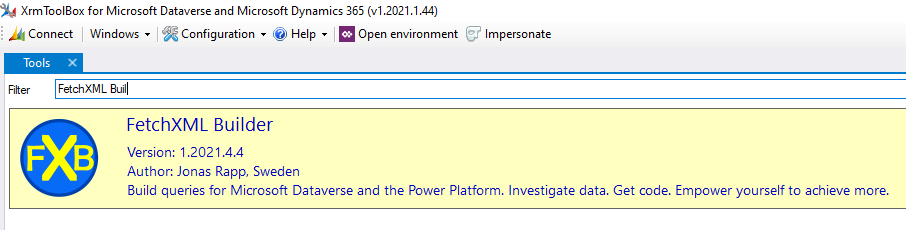
1. Launch XRM Toolbox and install FetchXML Builder from the Tool Library
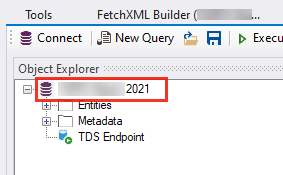
2. Open FetchXML Builder and connect to the D365 CE environment
3. Click New
4. Paste the FetchXML code to the FetchXML canvas in the FetchXML Builder
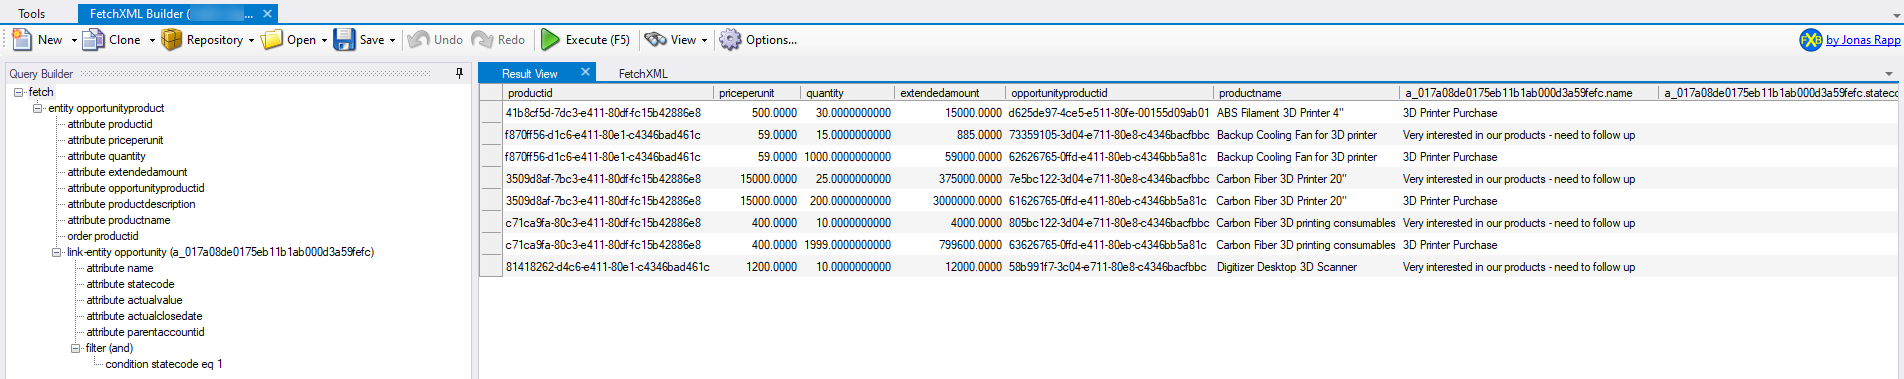
5. Click on Execute (F5) button
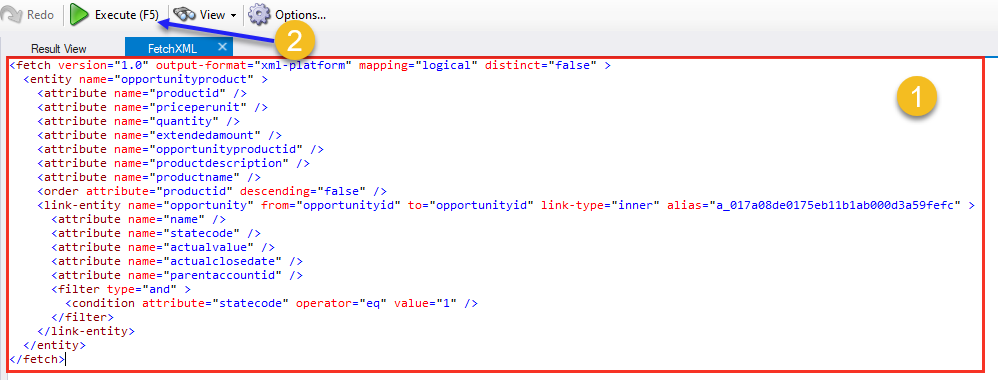
6. List of records is displayed in the Result View tab
7. Click on View and select SQL Query
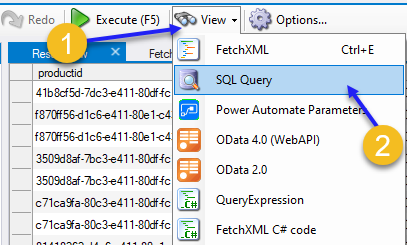
8. Click on Edit in SQL 4 CDS and this will convert FetchXML to SQL query
![]()
9. A new tab created with SQL query
*As noticed, TDS Endpoint is used to connect to D365 CE online database
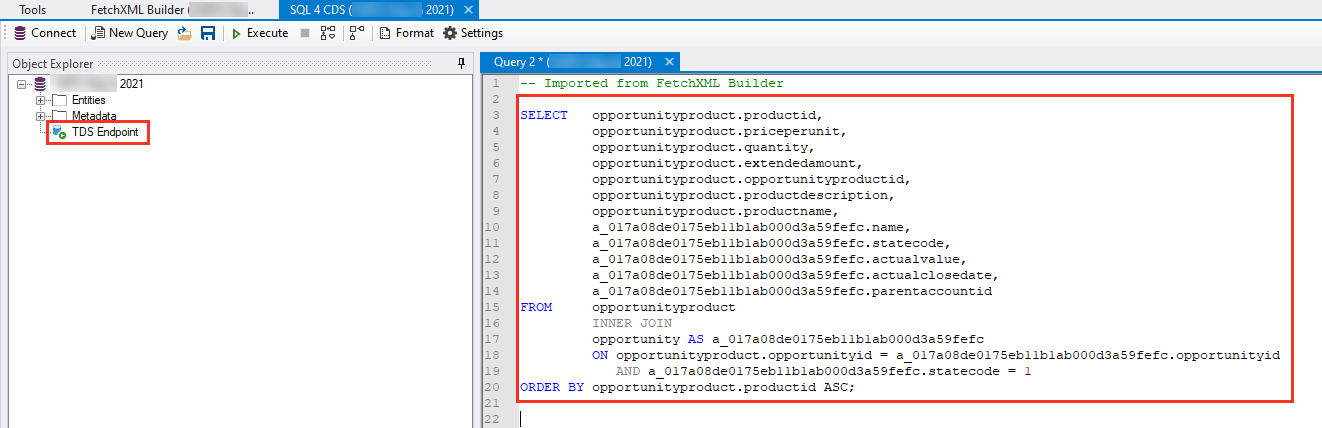
10. Copy the SQL query
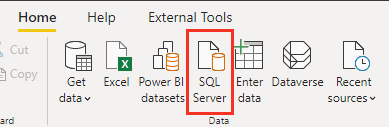
1. Launch Power BI Desktop
2. Click on SQL Server in the Home ribbon
*We use SQL Server as data source connector instead of Dataverse connector. We take an advantage of TDS endpoint and use the SQL Server connector
3. Enter the Server name with the D365 CE online URL without “https://”
4. Ener Database name from the SQL 4 CDS / FetchXML Builder window
5. Paste the copied SQL query to SQL statement text area
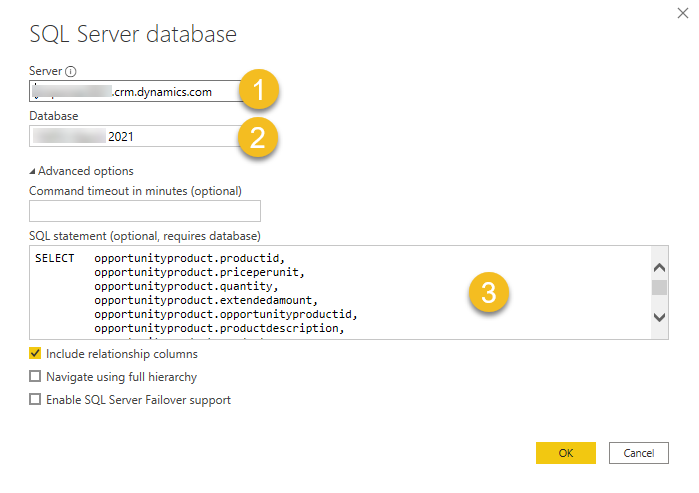
6. Click OK
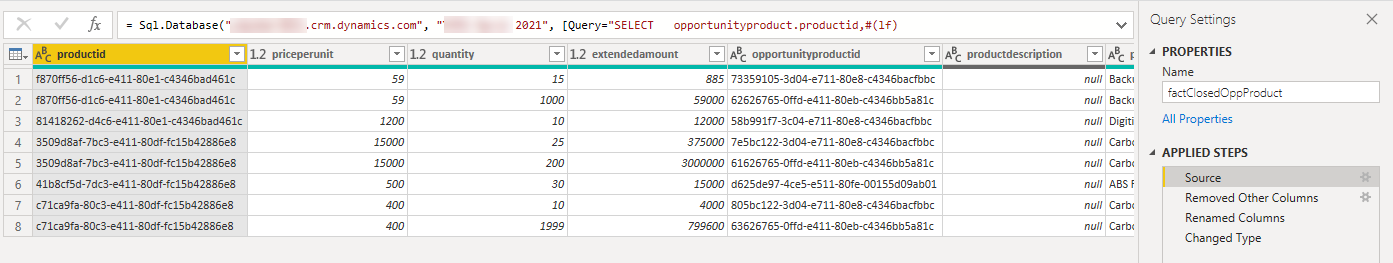
7. Transform data as needed and name the query as factClosedOppProduct
We created a fact table in Power BI from the D365 CE online view
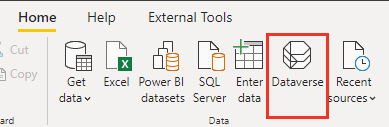
8. Select Dataverse in the Home ribbon
9. Enter D365 CE online URL without “https://” in the Environment domain
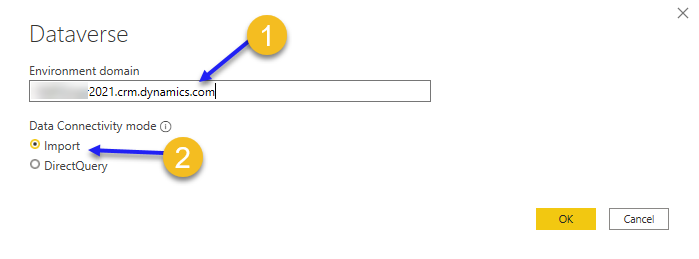
10. Select Import and click OK
*Enter credential if asked
11. Select account and transform data
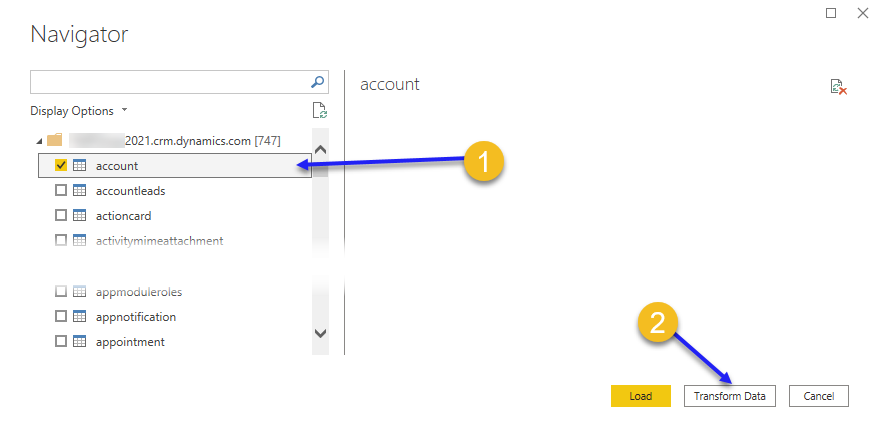
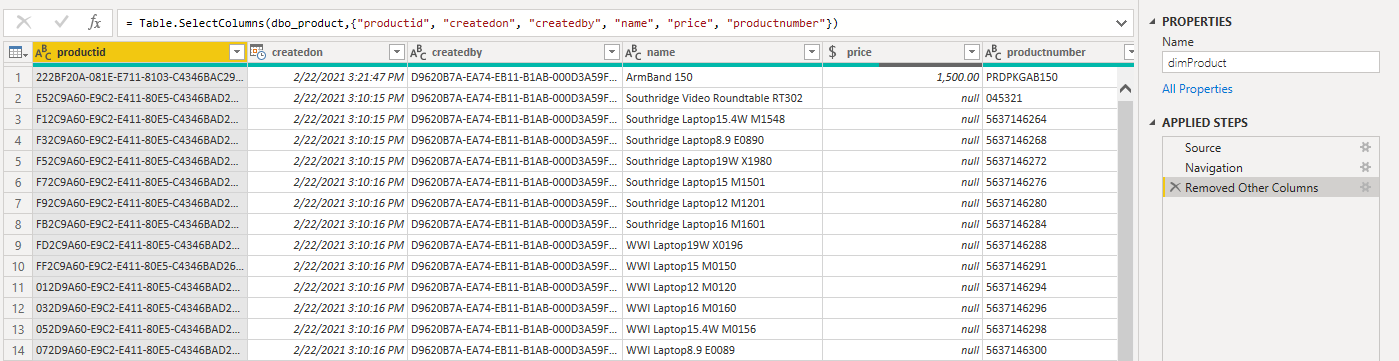
12. Select columns for use and name the query as dimAccount
*We created a dimensional table with Dataverse connector

13. Repeat the same process above and create dimProduct table with Dataverse connector
1. Click on Close & Apply button in Power Query Editor and import data to Power BI Desktop
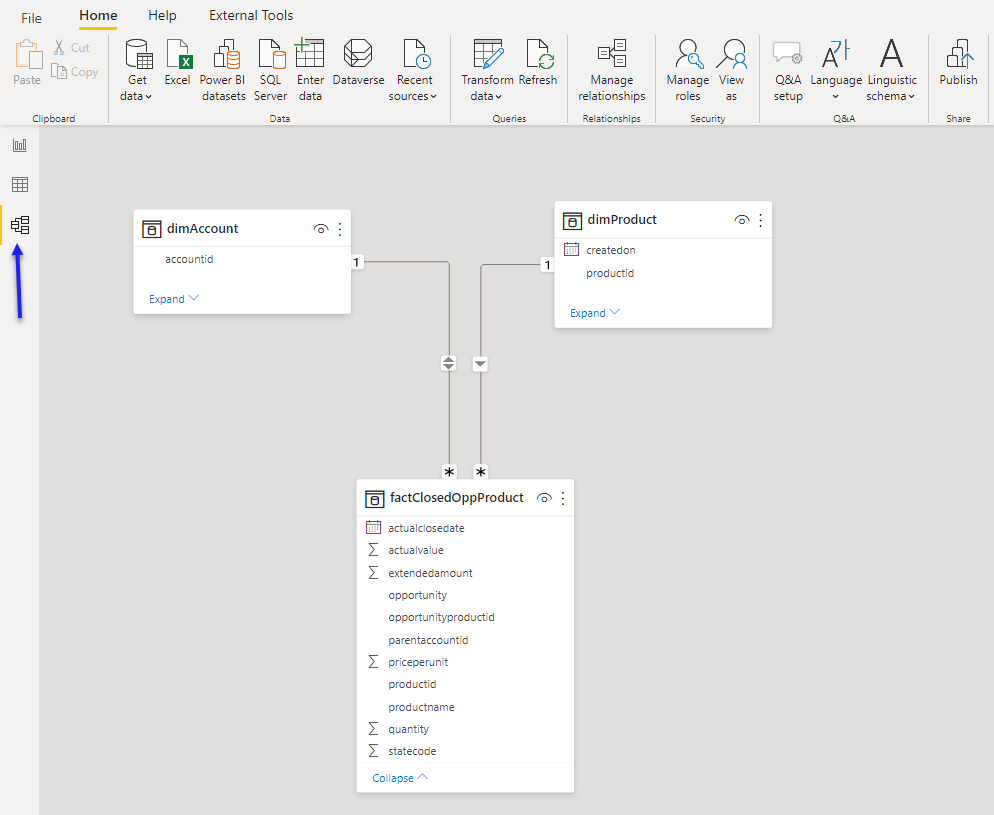
2. Click on Model icon and create a data model – Star Schema (with two dimensional tables and one fact table)
1. Click on Report icon and open a new report page
2. Click on Matrix visual and add columns to the visual
Quantity, Unit Price and Revenue by Account by Opportunity name and by Product name
3. Click on Slicer visual and create slicers for Product and Account
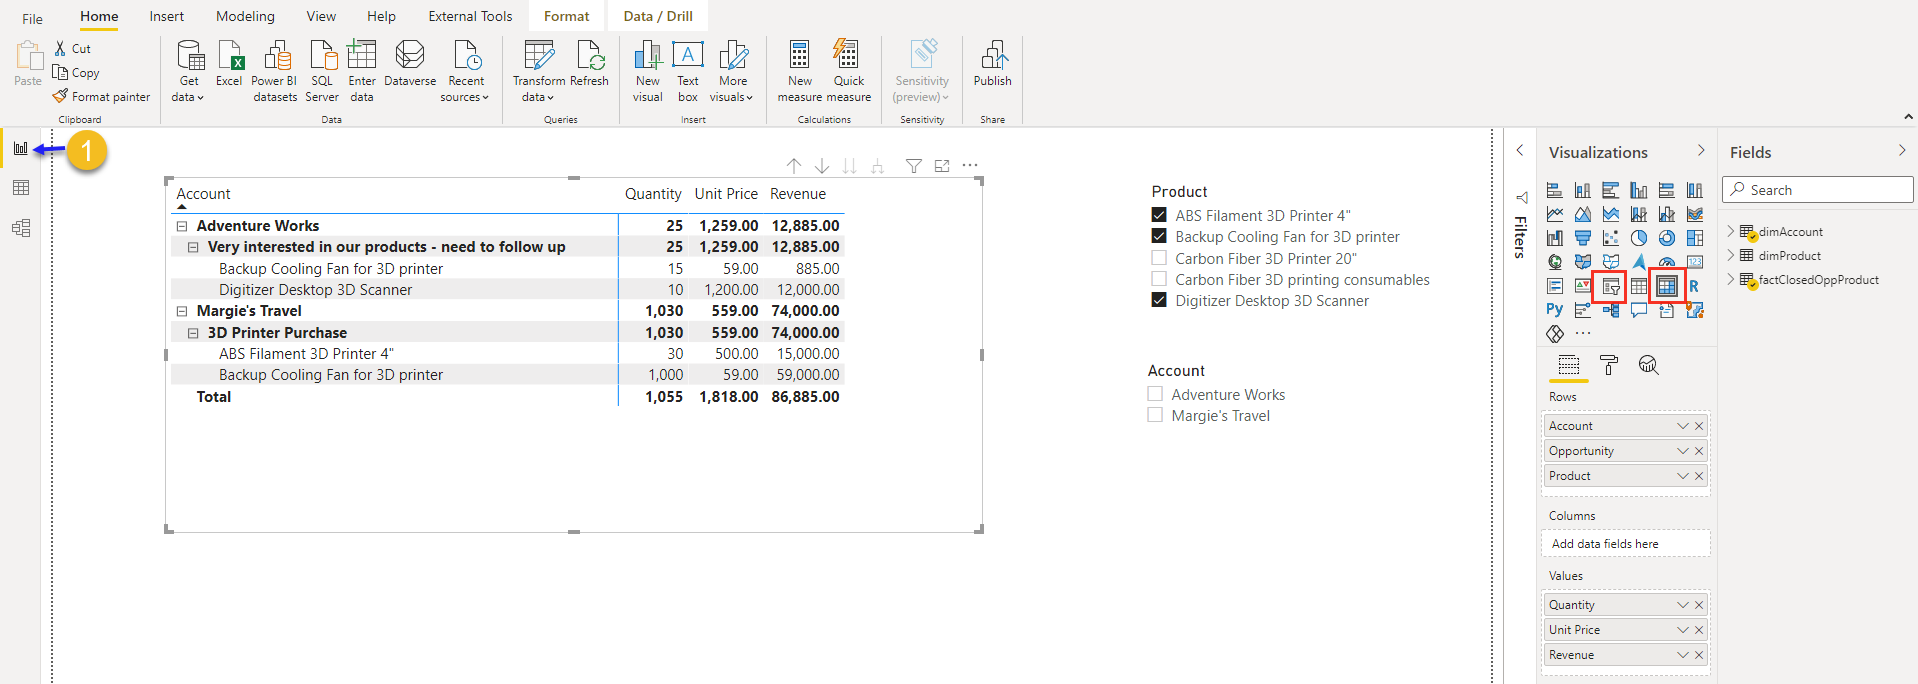
Here we have a Power BI report!
This approach can be used for many other report requirements, and we can create reports with star schema. We used Dataverse connector for dimensional tables and created a fact table with a view in D365 CE online. We retrieved data with SQL Server connector and with SQL query converted from FetchXML.
Resource References:
Happy Power BI’ing!