How Microsoft Power Platform is helping to modernize and enable...
In this webinar, our experts showcase a variety of demo use cases of how different components of the...
In this blog, we would like to discuss Power BI reports with Dynamics 365 Customer Insights (CI) as a data source. We discuss the Audience Insights module, which helps organizations build a deeper understanding of their customers. The contact (customer) data from various transactional, behavioral, and observational sources in their organizations are used to create a 360-degree customer view.
We can create KPIs (key performance indicators or measure), segments (list of customers), and enrichments to analyze data from customer profile level to an organizational level in Customer Insights. These analyses are limited when creating dynamic and visual reports like Power BI can offer. Power BI includes an out-of-the-box connector to Customer Insights data. (Preview feature was covered in an earlier blogpost.)
We would like to walk you through the high-level steps for setting up a Customer Insights environment to create Power BI reports with CI data, including public references.
There is a great training material provided in Microsoft Learn. By following the steps in the exercises, we can launch a free 30-day trial:
This exercise provides sample datasets, including eCommerce Contacts, Loyalty Contacts, Online Purchases and Point of Sale POS Purchases (In-store) transactional data and Website Review data in txt format. Contact datasets have 5,000+ records and transaction datasets have 20,000+ records. They are great for sample datasets, and we do not need to create nor source data in Marketplace.
Please follow the tasks in the links below for data ingestion and data unification as well as Activity and Relationship configurations. In the next section, we start with creating measures and segments.
Link to Microsoft Learn Customer Insights learning exercise:
There is a training material provided in Microsoft Learn about Measures. Please refer the link below.
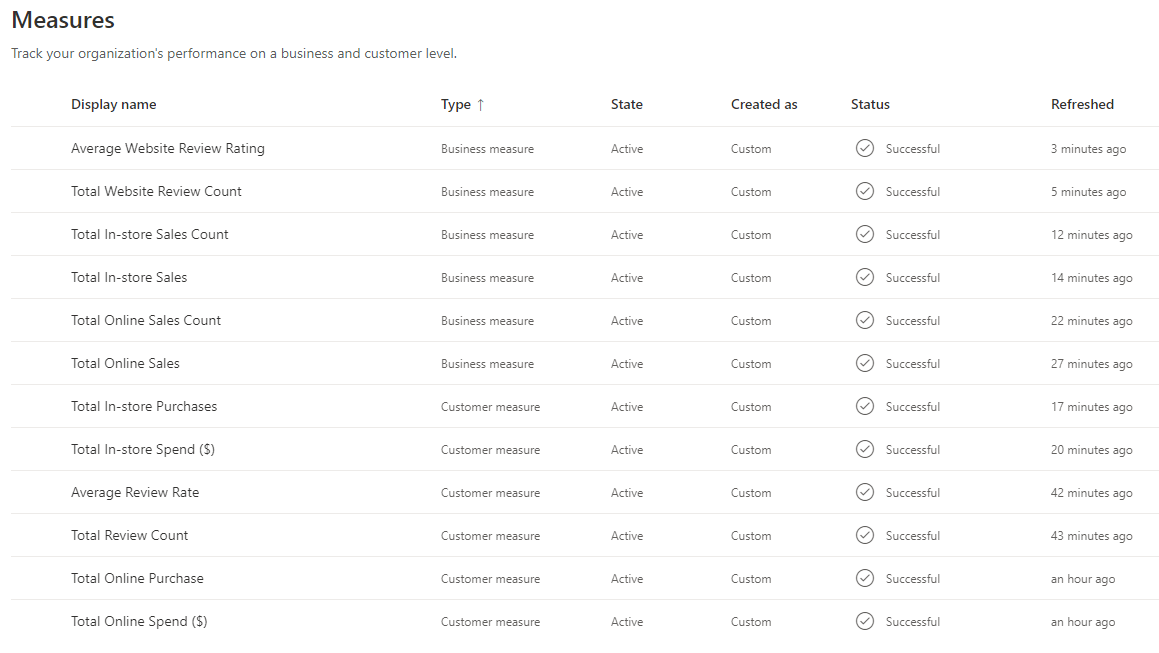
There are two types of measures (KPIs) in CI. One is Business measure and the other is Customer measure. Business measure is a KPI for the entire organization so that we get a single KPI with an aggregated number. Customer measure is calculated per customer so that we get a KPI per customer in list format.
We created business and customer measures below in our CI environment:
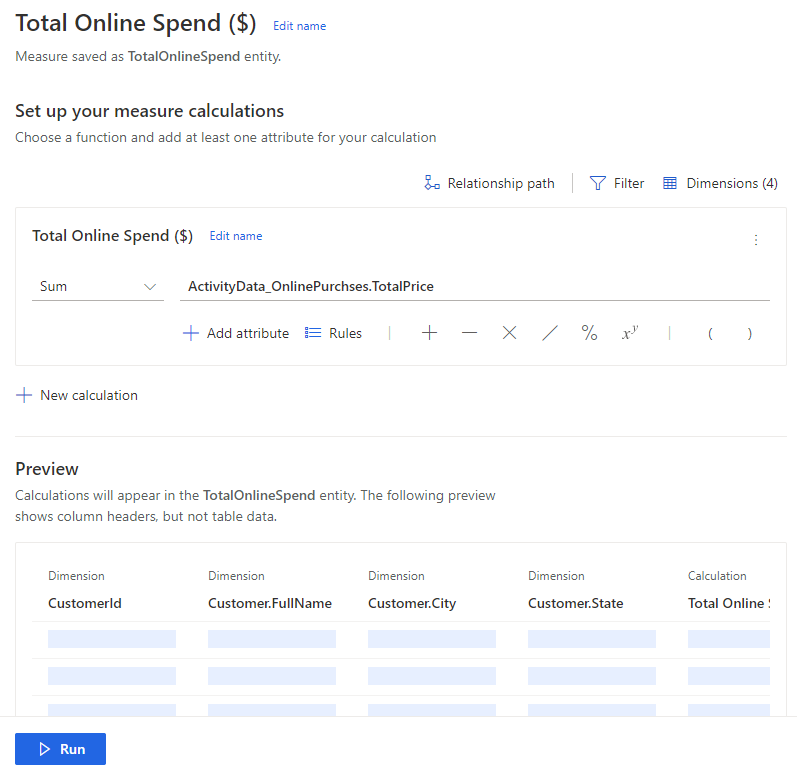
Total Online Spend ($) Example

Total Online Spend ($) Calculation
There is a training material provided in Microsoft Learn about Segments. Please refer the link below.
Segments are a list of customers with certain conditions or queries applied to better understand the customers, and they are used to run campaigns. We can create segments from blank, the Customer Profile, measures, or existing segments.
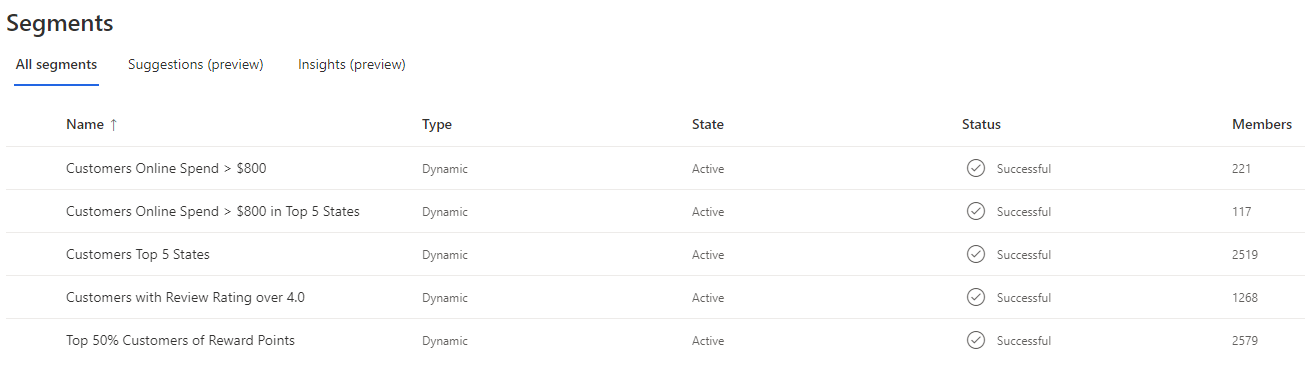
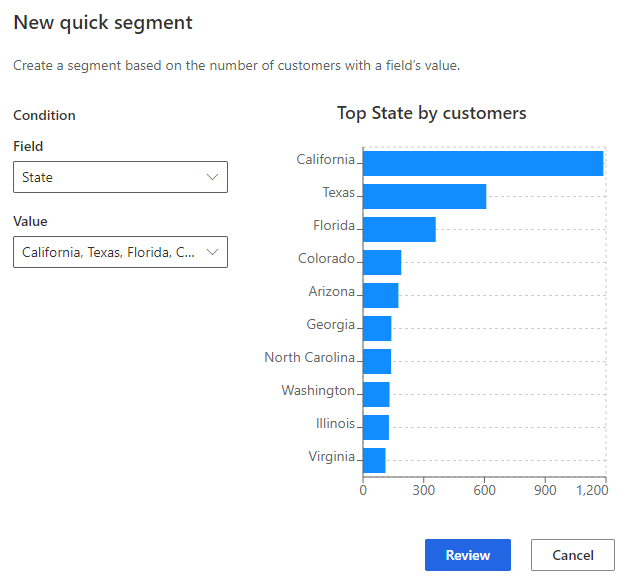
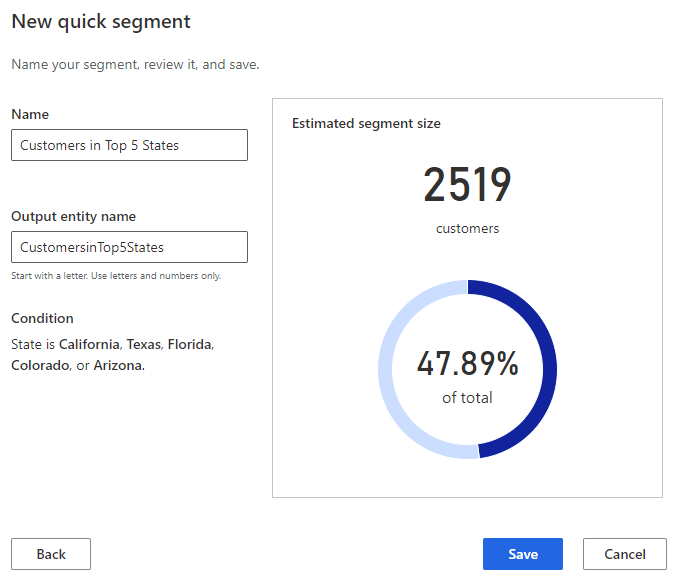
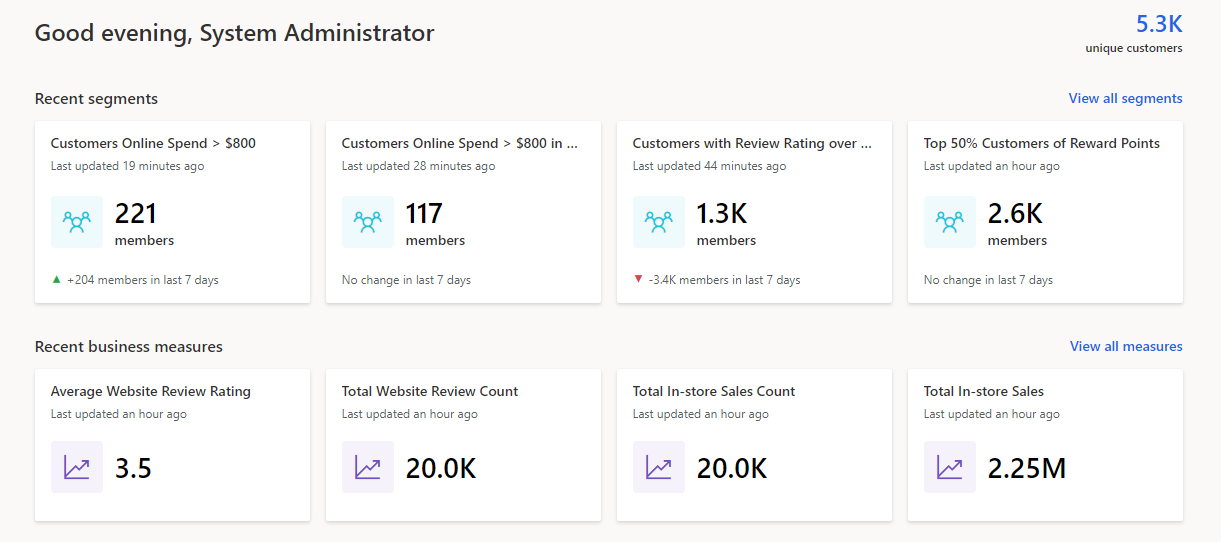
The segments below are examples. Customers Top 5 States segment is created from the Customer Profile. We select “State” from the field and select top 5 states in the Value. Then the wizard shows the preview of the segment. We give it a name and save.
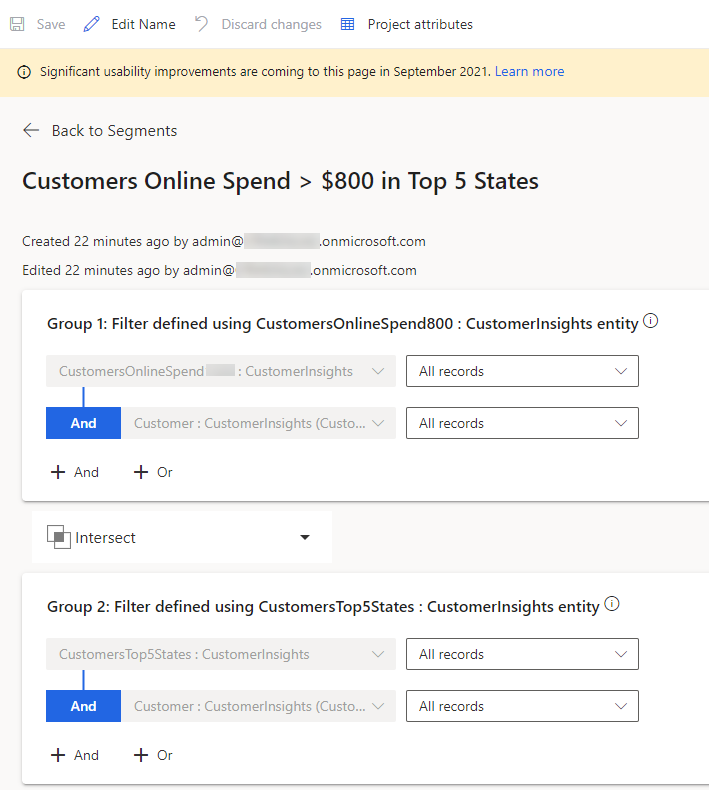
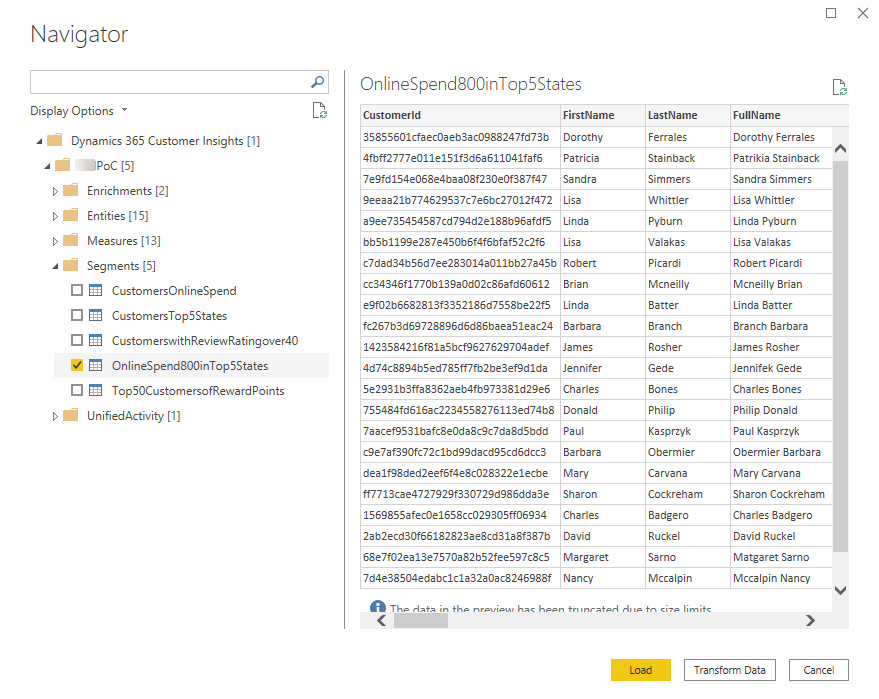
Another example is Customers Online Spend > $800 in Top 5 States. This segment is created from the other two segments created prior. We intersect the Customers Top 5 States segment and Customers Online Spend > $800 segment and the result is 117 customers.
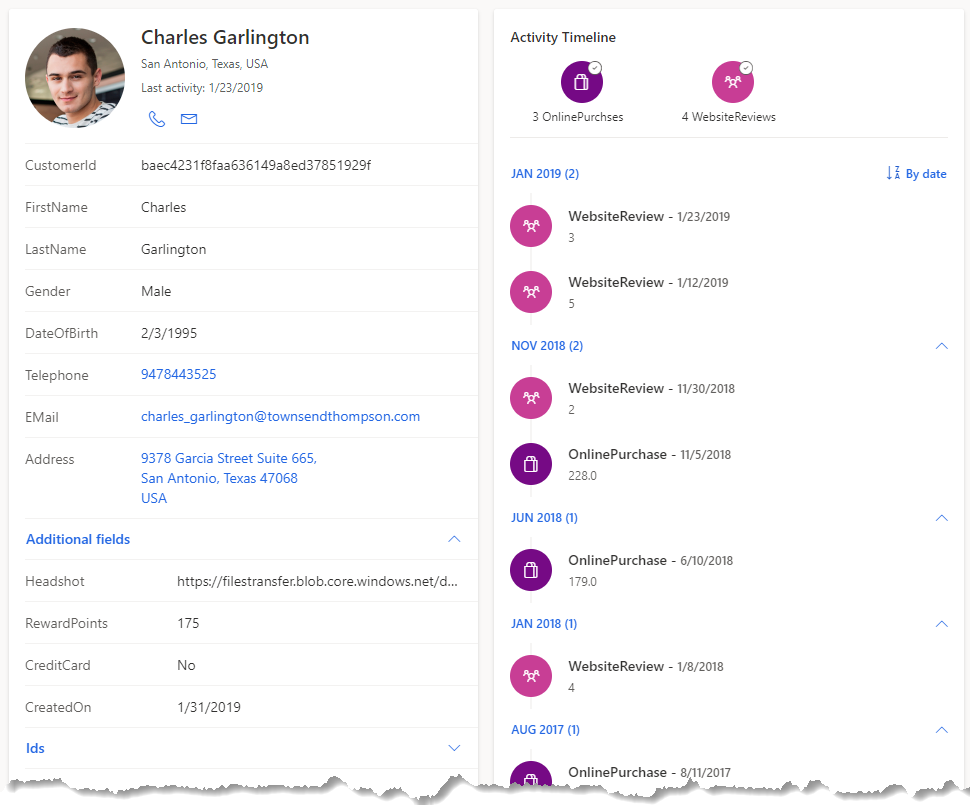
We now completed creating customer profiles, measures (KPIs) and Segments in Customer Insights – Audience Insights. Here is the home page and an example of the customer profile.
This is great!
We also like to further analyze customer data with slicers and visuals in Power BI.
Connect from Power BI to CI
Power BI provides an out-of-the-box connector to Customer Insights (preview).
Let’s launch Power BI Desktop. Click on Get data button in the Home ribbon. Type “Customer” in the Search box.
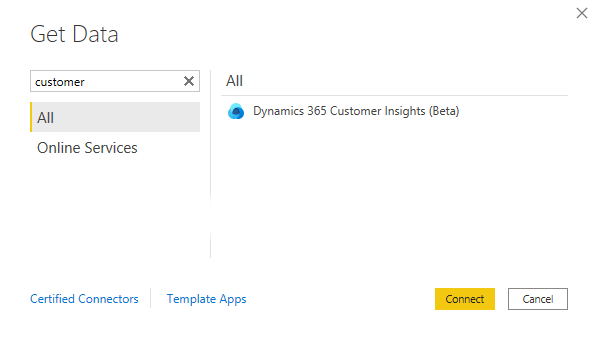
Let’s select “Dynamics 365 Customer Insights (Beta)” and click Connect button. Click Continue button for a disclaimer.
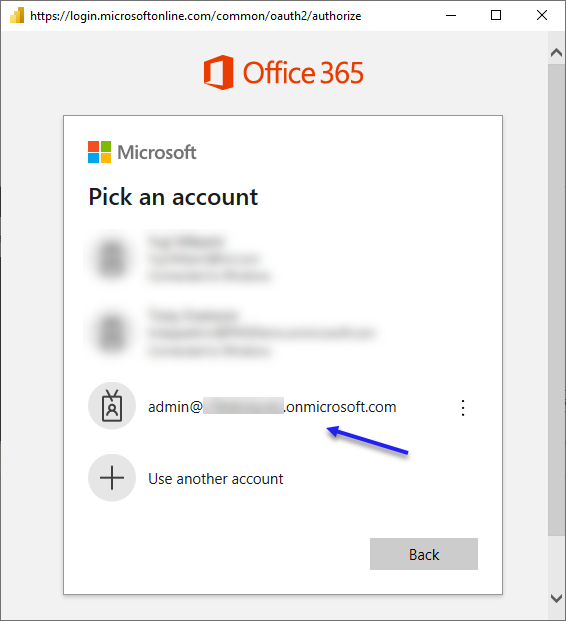
When the Authentication window appears, log in with the same user as logged in Customer Insights. The user must have an administrator role assigned in the Permission page in Customer Insights.
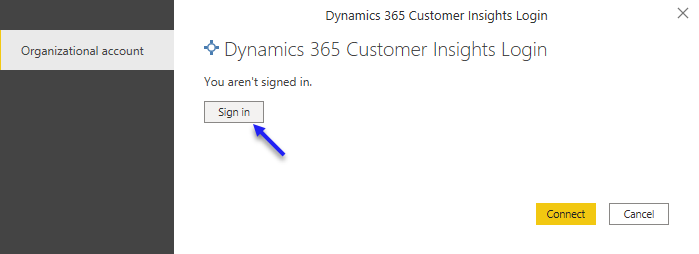
Below image is an example. Once signed in, click Connect button.
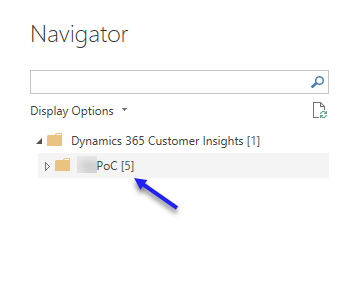
Once connected, Navigator window is displayed like image below. The environment name is shown in a hierarchical folder structure.
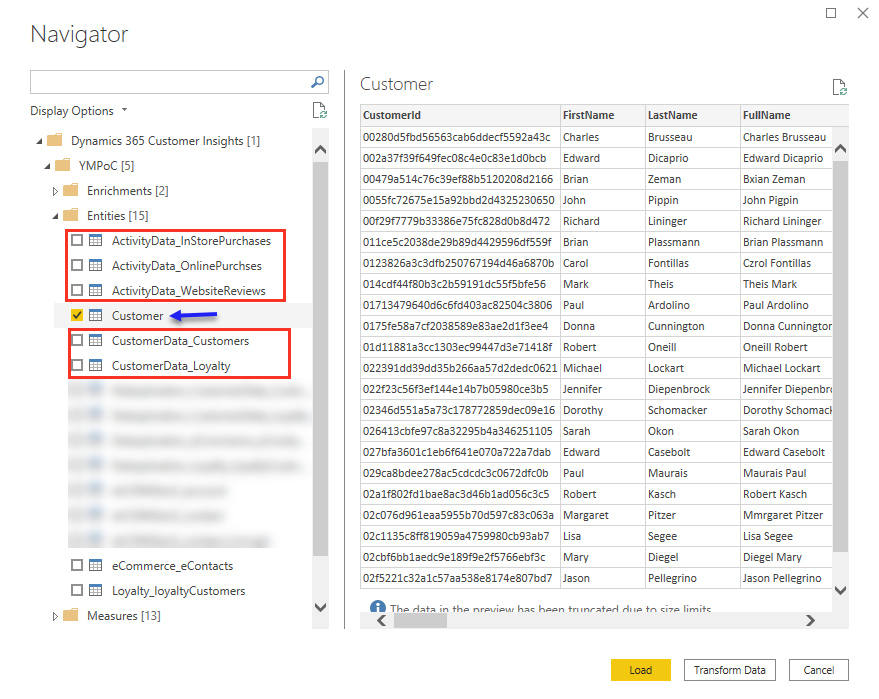
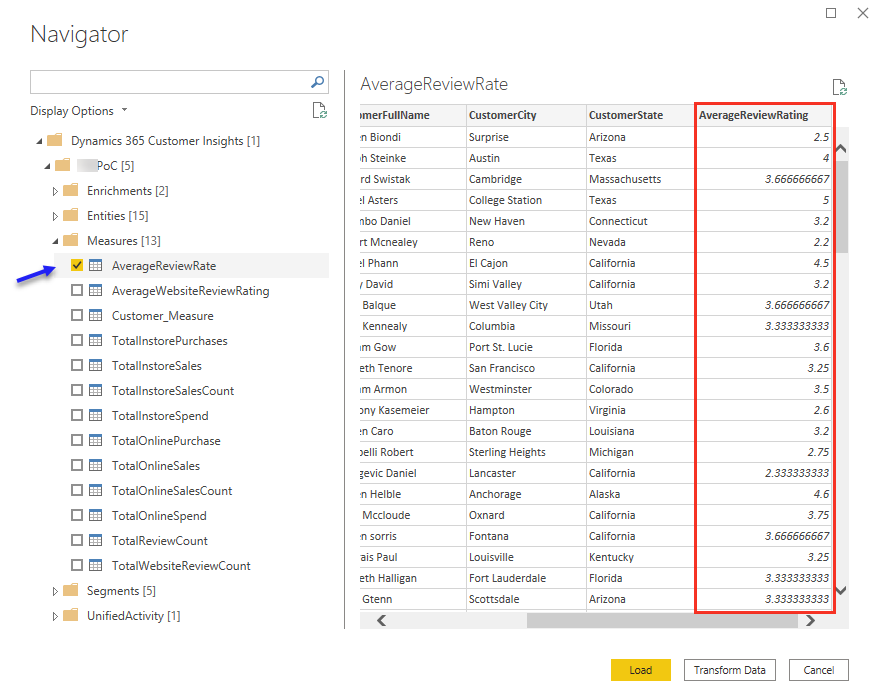
One of the great designs of the connector is that not only are entities available as datasets, but other tables (list of customers) we created in CI as measures and segments are also available!
What this means is that we do not need to recreate datasets in M query and in DAX from the data source entities in Power BI if we need an aggregated dataset for instance. These datasets are filtered already so that the size of datasets is smaller and better performance is expected in Power BI.
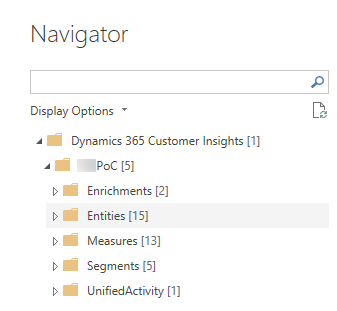
Let’s expand the folder. It includes Entities, Measures, Segments, UnifiedActivity, and Enrichments.
We can see two contacts data sources (Customers and Loyalty) and three activity data sources (InstorePurchases, OnlinePurchases, and WebsiteReviews).
The Customer entity selected is Customer Profile entity created by Customer Insights. So that we want to ingest this master entity with other activity entities to Power BI.
We can see the list of Measures as customer datasets. For example, AverageReviewRate dataset is available so that the average rating per customer data is calculated and we do not need to create measures in DAX in Power BI.
We can see list of segments as customer datasets. For example, we created a segment from other two segments earlier, Customers Online Spend > $800 in Top 5 States. This customer profile dataset is available for Power BI.
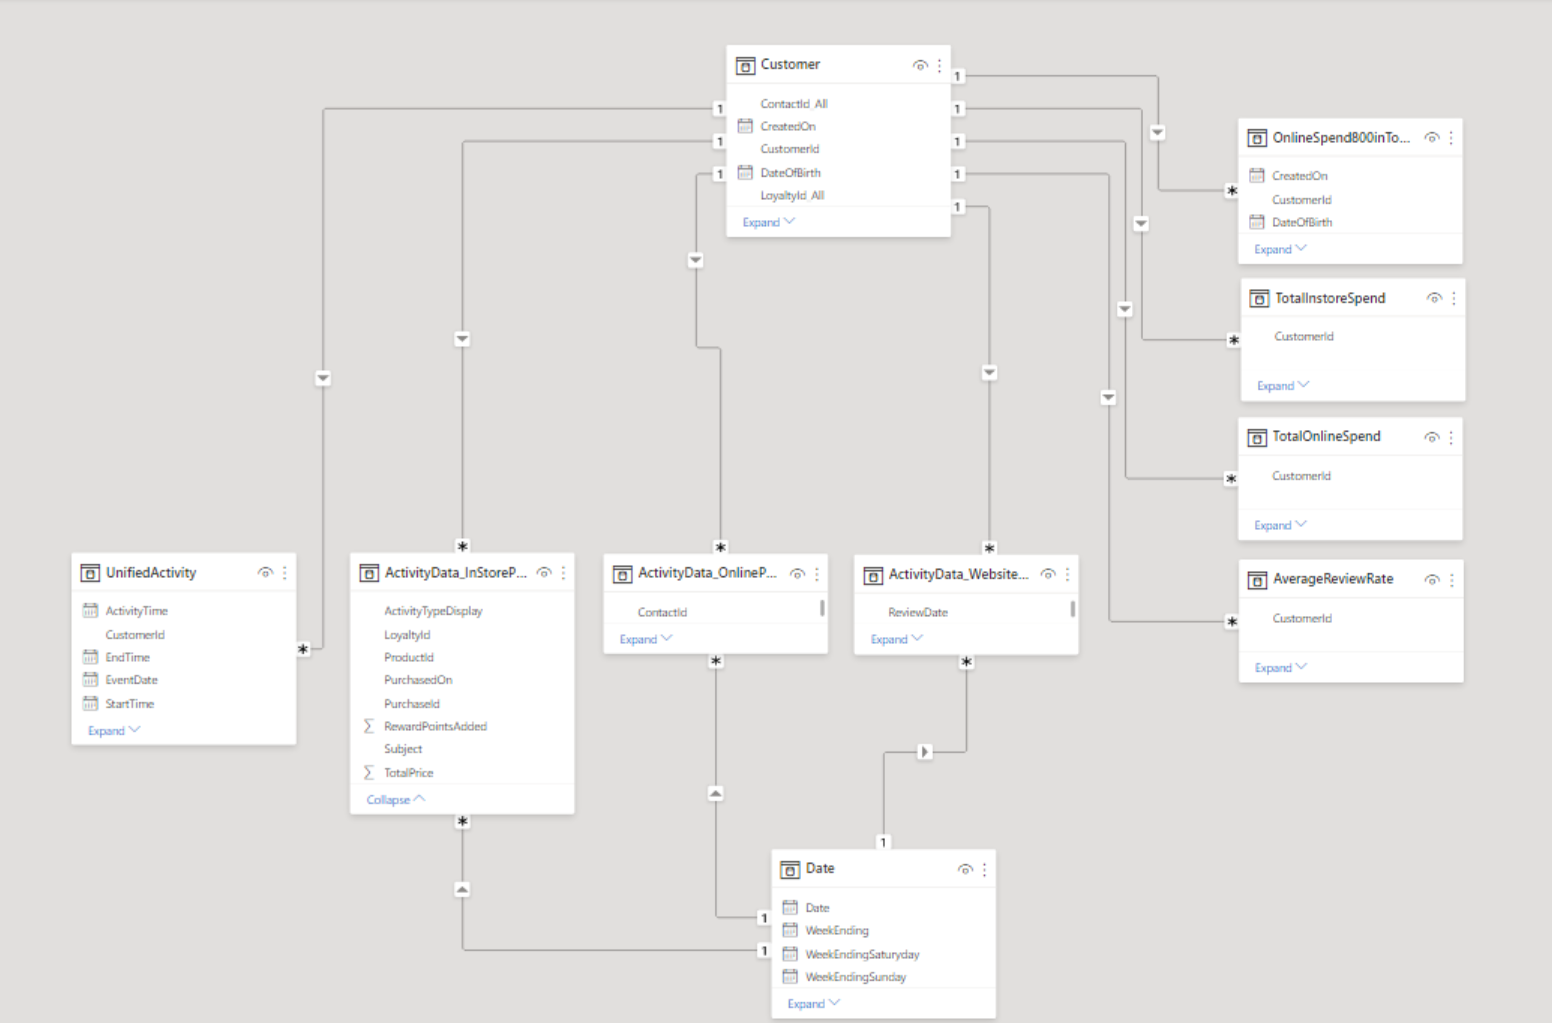
Once selecting entities, we transform some data in PowerQuery and create data model.
The image below is an example of a data model we created for this blog. Customer and Date datasets are dimensional tables and the rest of the datasets are fact tables.
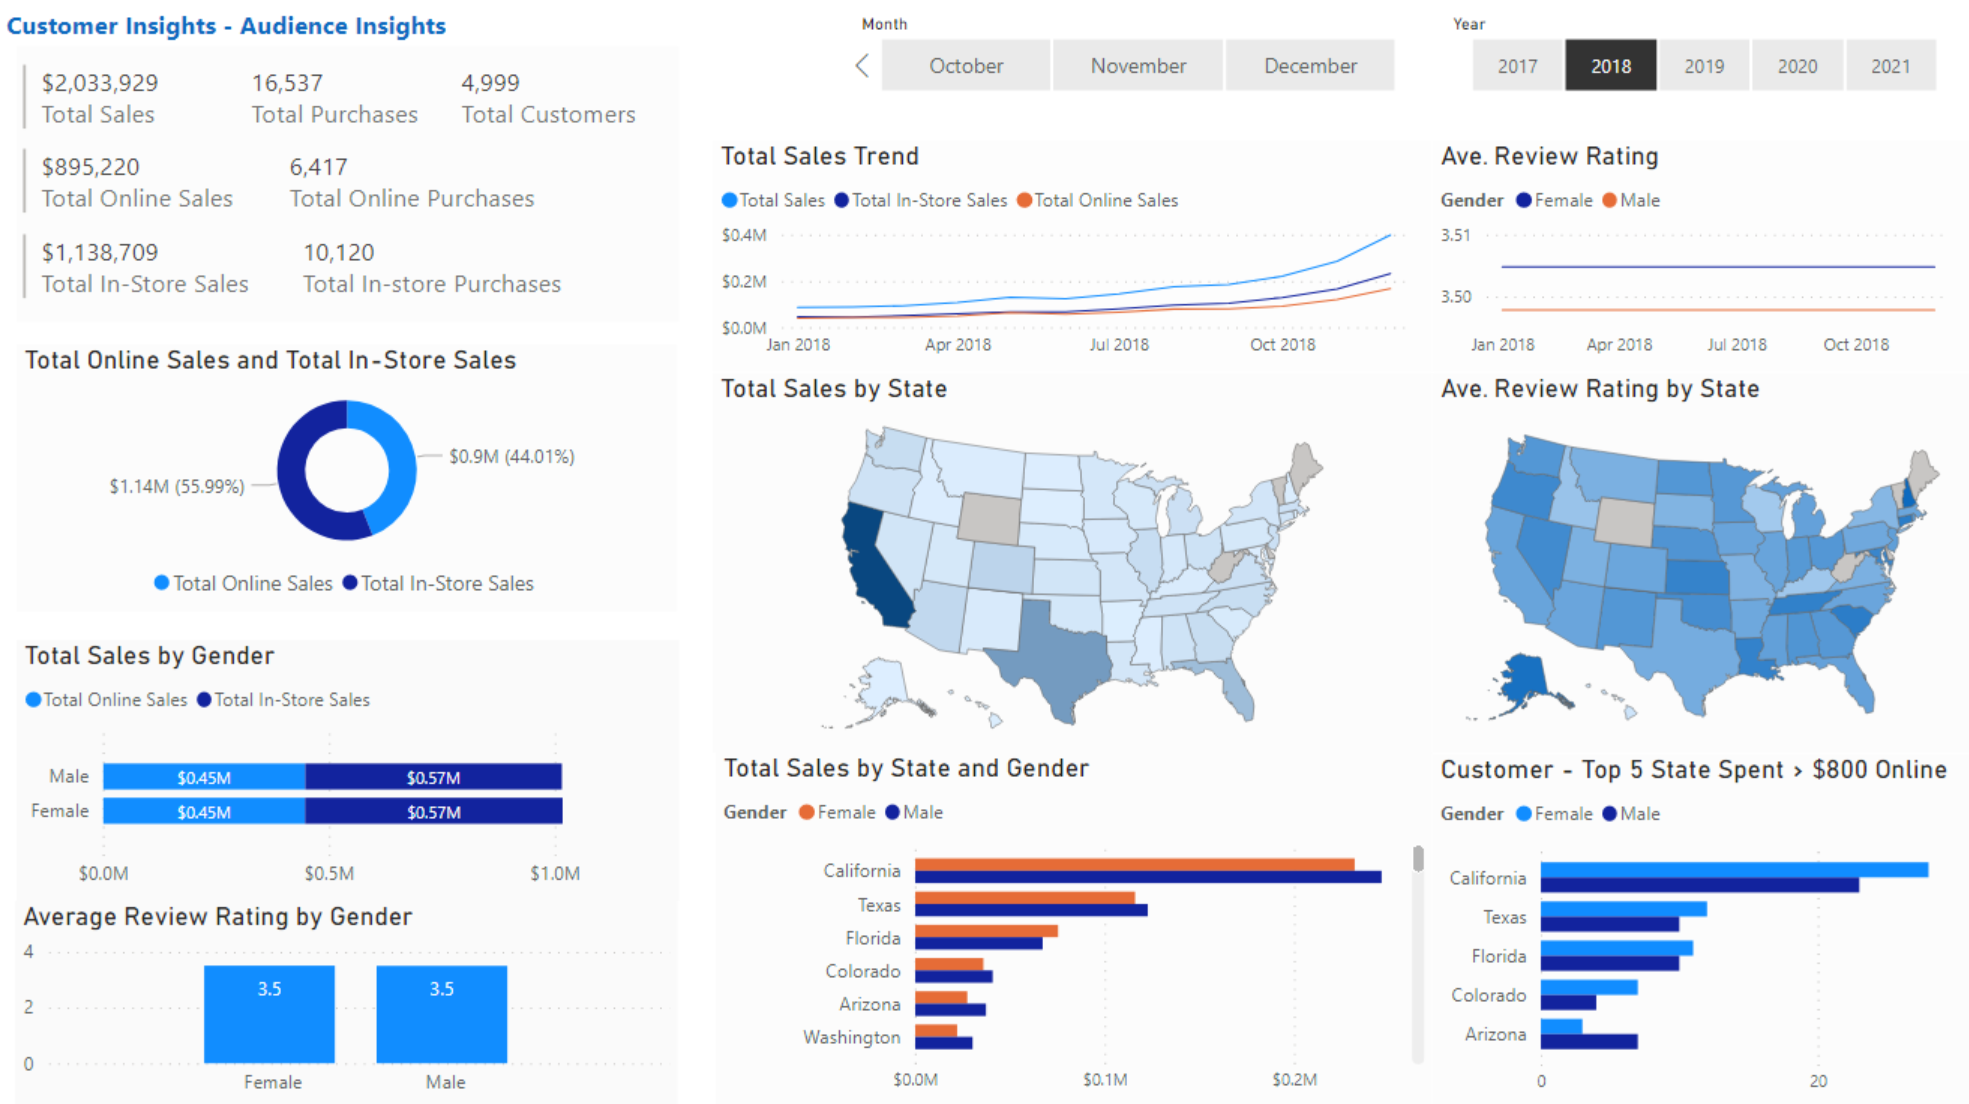
We created measures and created an overview report with the datasets.
Happy Power BI and CI’ing!