
How Microsoft Power Platform is helping to modernize and enable...
In this webinar, our experts showcase a variety of demo use cases of how different components of the...
By now, we all know the amazing things PowerMailChimp can do. What is better than bringing the ease and comfort of MailChimp's powerful data directly into CRM to see who is doing what with your emails and email content?
Clicks, opens, and unsubscribes are significant data, but how about taking analysis and decision making to the next level? If you care about the demographics of your target audience and want to see who is more interested in your email content, then a simple power pivot can help you unearth a gold mine of valuable information.
To keep things simple, let's assume that you keep track of your contacts' age, gender, marital status, etc. By the way, did we mention that you are a florist? You send out email blasts regularly announcing the arrival of fresh flowers or specials you may have on certain days. You send out your email blasts through PowerMailChimp to all your contacts and get your opens, clicks, bounces, and unsubscribes immediately.
Now you want to dig deeper and find out more about your target audience.
Here is what you do:
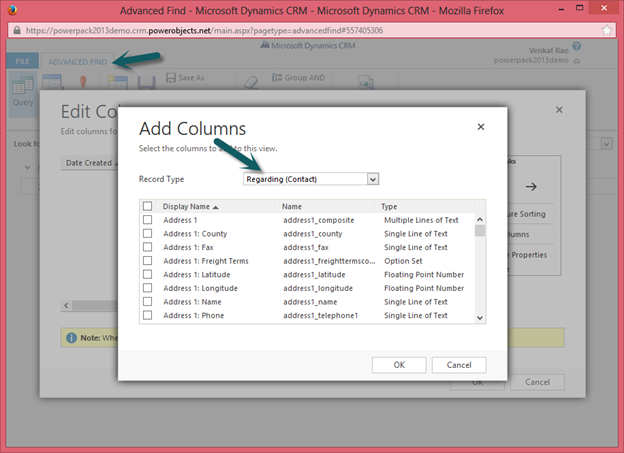
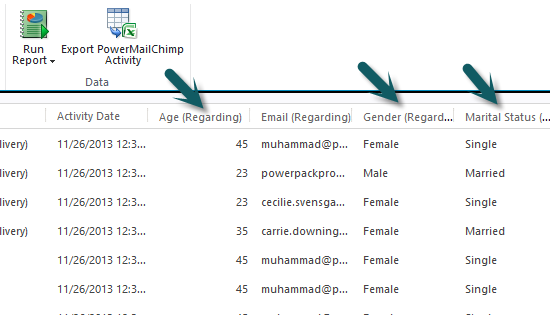
1. The very first step is to export your PowerMailChimp Activities for a specific blast to Excel and make sure to add columns from the related contacts to the advanced find query so that your results have the columns you require — like age, gender, marital status, etc. (To make things easier in the end, create a dynamic worksheet, but more on that later.)
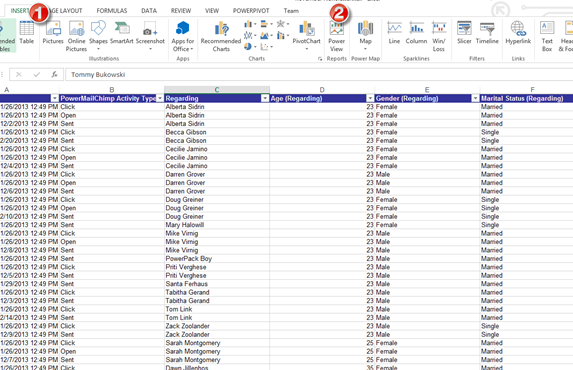
2. Once you have your results, export them to Excel. Note: The Excel file would be a .xml file. Save it as a .xlxs.
3. Once your .xlxs file is ready, you can start building your Power View. Insert tab > Power View button. (For detailed step-by-step instructions on how to create Power View in Excel, check out this blog.)
Create a new Power View sheet, get rid of the default table and start throwing fields from the range. To begin, we will create age groups – buckets of different ages from our list. Drag and drop Age from the Range. In the Fields area, choose Do Not Summarize.
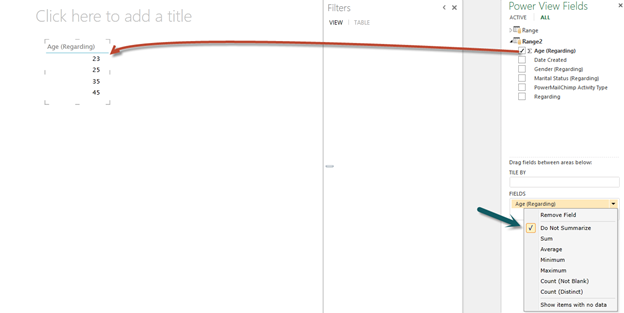
That creates our age groups.
Now, on to the steps to create charts.
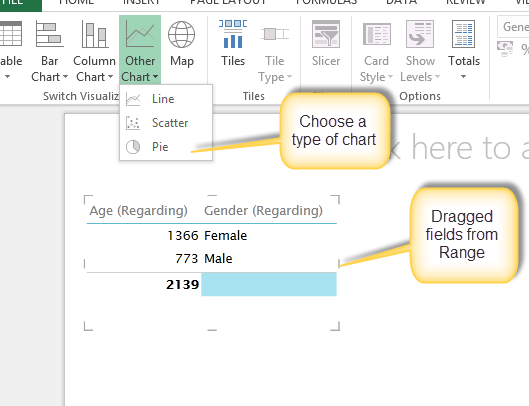
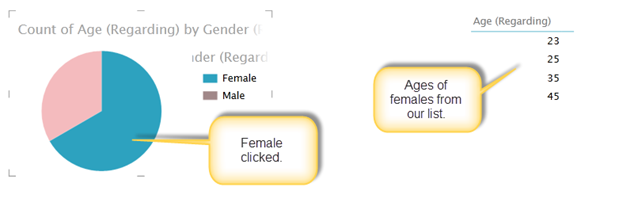
4. Drag Age and Gender to the view. Under Design, Switch Visualization, choose a chart type (we chose Other Chart > Pie).
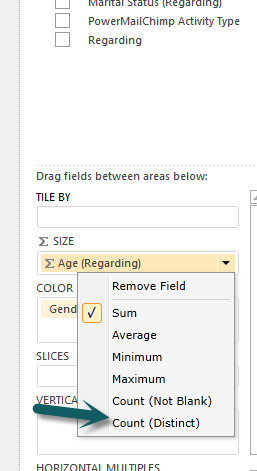
5. Under Power View fields, switch Age to Count (Distinct).
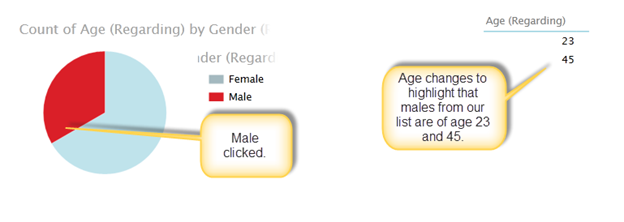
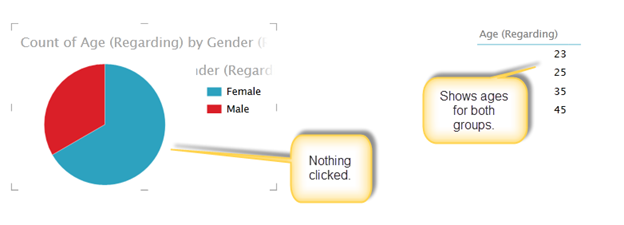
6. Our chart is ready. It shows us the ratio of male/female by age. Clicking the pie chart displays the ages for each gender.
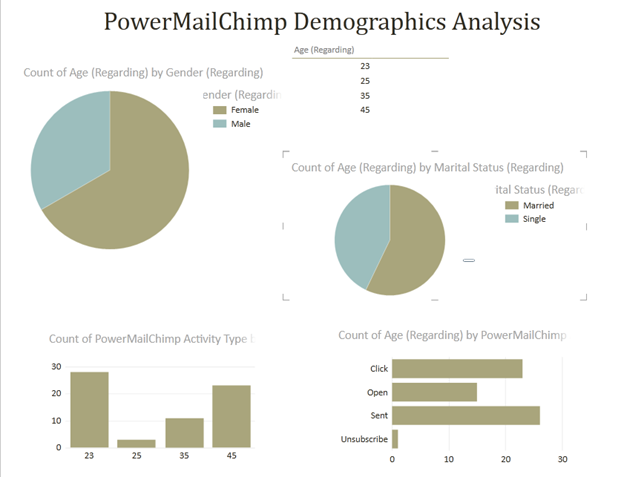
7. We will set up three other charts using the same procedure.
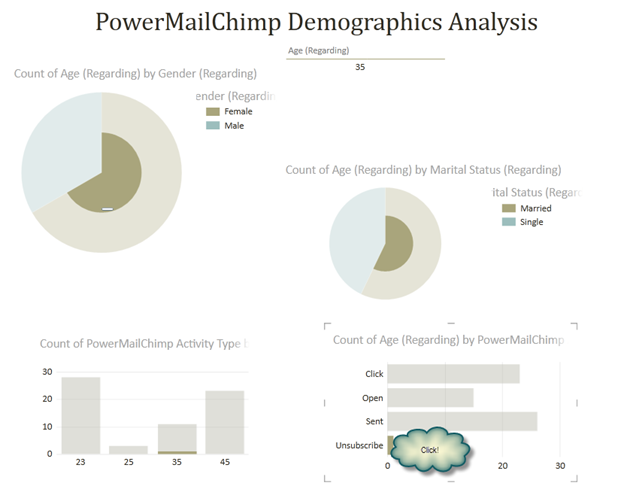
Once we are done, our charts (or should we just call it a dashboard) looks like this:
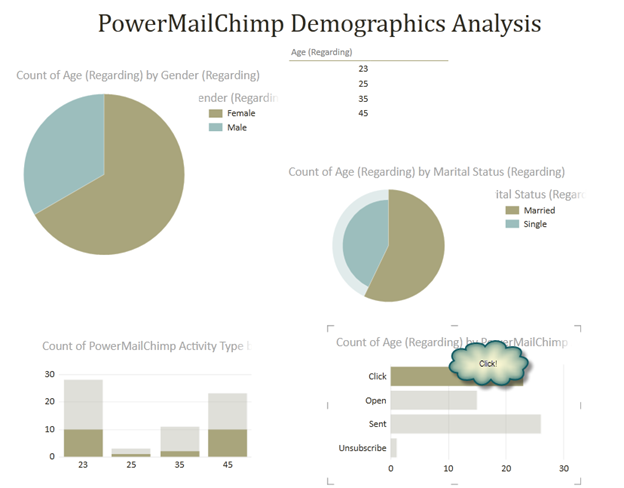
This dashboard is interactive. Clicking on any of the pie or bar charts will cause the other charts to show meaningful data. For example, if you want to see the demographic of Contacts who clicked on links in your email, just click the Click bar on the bottom right chart. You will see immediate results, showing that it's mostly married females of age 23 and 45 that are clicking those links. You would want to perhaps start a special for that demographic to attract them for future business.
What are the single people up to? How do they react to your newsletters? The dashboard tells us that it's mostly 45-year-old males and females who are interested in your emails. The 35 and 25-year-olds, not so much.
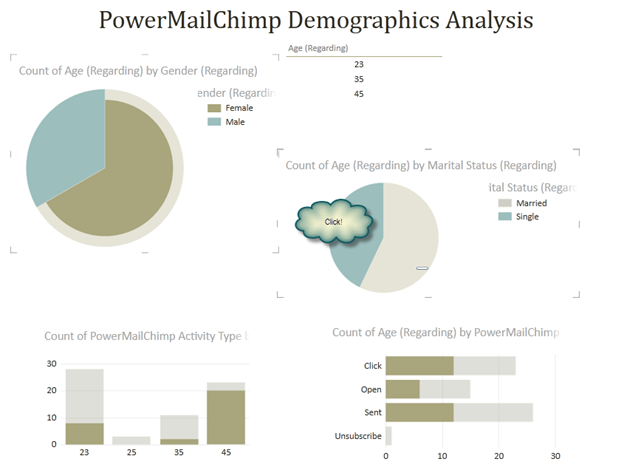
Who unsubscribed? Clicking the Unsubscribe bar shows us the guilty party! It's a 35 year old married female. If this demographic frequently unsubscribes, then maybe that's not your target audience?
We used a very simple set of data and examples to show how you can use Dynamics CRM, PowerMailChimp and Power View to enhance your decision-making, and to understand your target audience. This is not limited to just PowerMailChimp activities – you can use data for any entity in CRM, combine it with Excel/Power View and use it for analysis, forecasting, or decision-making. Let your creativity run wild with the power of these tools!
The combination of Dynamics CRM, PowerPack add-ons, and Excel Power View can provide great insights to help you plan your future campaigns with more confidence. No need to spend hundreds or thousands of dollars on specialized business intelligence tools anymore! Follow these steps and your CRM analysis and decision making with PowerMailChimp and Power View will be taken to the next level!
Happy CRM'ing!